Statistics

Description

Statistics revision mind map
Ross McKay
Mind Map by Ross McKay, updated more than 1 year ago
Ross McKay
Created by Ross McKay almost 9 years ago
153
1

Resource summary

Statistics
  1. Sampling
    1. Quota
      1. Convinience
        1. Straified
          1. Random
            1. Cluster
              1. Systimatic
              2. Calculations
                1. Standard Deviation
                  1. Calculates Average distance from the mean
                    1. Measures of spread
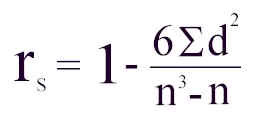
                    2. Spearmans Rank Corrolation Coefficient
                      1. Tests for corolation
                        1. Positive
                          1. Negative
                        2. Variance
                          1. Similar to Standard devation
                            1. Standardised Scores
                              1. Standardised Score = (Value - Mean) / Standard Deviation
                                1. Anything above 0 is better than average
                                  1. Less than 0 is worse than the mean
                                2. Averages
                                  1. Mean
                                    1. Median
                                      1. Order all the values and find the middle
                                      2. Range
                                        1. Mode
                                          1. Most common value
                                          2. IQR
                                            1. LQ
                                              1. 1st quarter
                                              2. UQ
                                                1. 3rd quarter
                                            2. Graphs and Charts
                                              1. Histograms
                                                1. Moving Averges
                                                  1. 4 point
                                                    1. 3 point
                                                    2. Z charts
                                                      1. Quality assurance
                                                        1. Scatter diagrams
                                                          1. Test for corolation
                                                            1. Positive
                                                              1. Negative
                                                          2. Probability
                                                            1. Scale
                                                              1. Impossible
                                                                1. 0
                                                                2. Even chance
                                                                  1. 0.5
                                                                  2. Unlikely
                                                                    1. 0.25
                                                                    2. Likely
                                                                      1. 0.75
                                                                      2. Certain
                                                                        1. 1
                                                                      3. Tree Diagrams
                                                                        1. Multiply along branches
                                                                          1. End results should add up to 1
                                                                            1. Fractions or percentages
                                                                          2. Data Comparison
                                                                            1. Box Plots
                                                                              1. Visual comparaison
                                                                                1. Maximum
                                                                                  1. Minumum
                                                                                    1. IQR
                                                                                      1. UQ
                                                                                        1. LQ
                                                                                          1. Range
                                                                                        2. Standardised Scores
                                                                                          1. Index Numbers
                                                                                            1. Simple Index Numbers
                                                                                              1. Percentages
                                                                                                1. Index Number = (Value / Value in base year) x 100
                                                                                                2. Chain Based Index numbers
                                                                                                  1. Index Number = (Value in previous year / Value in current year) x 100
                                                                                                  2. Weighted Index Numbers
                                                                                                    1. Weighted Index Number = Σ(Index Number x Weight) / Σ Weights
                                                                                                3. Data Comparison Cont.
                                                                                                  1. Crude Rates
                                                                                                    1. How many in every thousand
                                                                                                    2. Standardised Rates
                                                                                                      1. More useful than crude rates
                                                                                                    Show full summary Hide full summary

                                                                                                    Similar

                                                                                                    Chapter 7: Investigating Data
                                                                                                    Sarah L
                                                                                                    The Exponential Model
                                                                                                    katie.barclay
                                                                                                    Statistics Key Words
                                                                                                    Culan O'Meara
                                                                                                    CUMULATIVE FREQUENCY DIAGRAMS
                                                                                                    Elliot O'Leary
                                                                                                    FREQUENCY TABLES: MODE, MEDIAN AND MEAN
                                                                                                    Elliot O'Leary
                                                                                                    HISTOGRAMS
                                                                                                    Elliot O'Leary
                                                                                                    TYPES OF DATA
                                                                                                    Elliot O'Leary
                                                                                                    GROUPED DATA FREQUENCY TABLES: MODAL CLASS AND ESTIMATE OF MEAN
                                                                                                    Elliot O'Leary
                                                                                                    SAMPLING
                                                                                                    Elliot O'Leary
                                                                                                    Fractions and percentages
                                                                                                    Bob Read
                                                                                                    GCSE Maths Symbols, Equations & Formulae
                                                                                                    Andrea Leyden